If you want to do well in Topcoder, live in Japan, South Korea, or Cape Verde
Background
Topcoder Single Round Matches are held at incredibly obscure times if you live in certain parts of the world (e.g Japan).
Most of the SRMs in the past 3 years were held at 5pm(GMT)=1am(Japan Standard Time), which means that East Asians may have been competing in SRMs half asleep.
The purpose of this quick analysis is to examine the effects of time on Topcoder performance.
Summary of Results
- Competing at night may have detrimental effects on performance.
- There's no evidence to suggest that a particular time from noon~evening is better than another.
- The current Topcoder schedule favors East Asians, and disfavors Americans.
Data
The Topcoder Data Feed provides data such as users' countries and past competition results.
I used data for all rated Div1 SRM results from Jan 2012 to Jan 2014 (=102 events)
A timezone was assigned to each user based on their country.
For countries with multiple timezones, I assigned the median (e.g CST for USA).
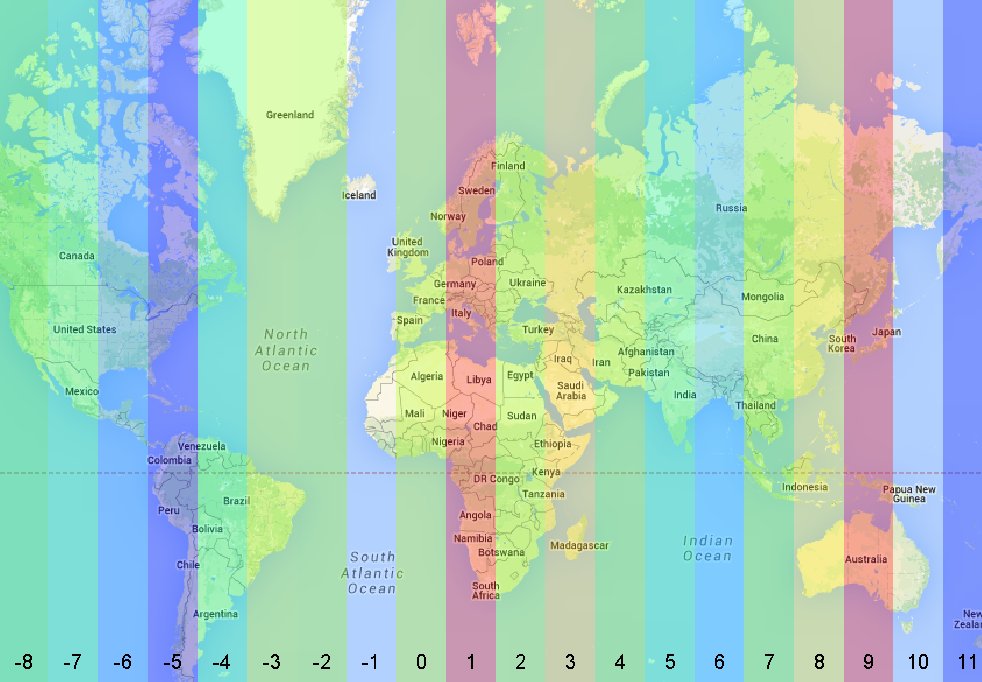
As an example, here's a visualization of the average absolute score of all Div1 results for each timezone.

Fig1. Average Div1 score for each timezone (Blue: 120 ~ Red:212)
You can see that there is great inter-timezone difference in the average score. Parts of South America have average of 120 (UTC-5), whereas East Asia has an average score of 212 (UTC+9).
The cause of difference may include factors like the number of competitors, education, etc.
In order to see just the effect of time on the score, I need to be able to normalize-out the inter-timezone differences.
I therefore calculated the "Normalized Score" metric to represent a user's relative performance in an SRM event.
For a particular user, I have a list of the user's score in each SRM he has competed in.
For each of these scores, I normalize the score by the average and standard deviation of all scores of events within 70 days.
This allows us to quantify how much better the user performed in an event compared to "usual", independent of other factors.
Local Time vs Normalized Score
For each SRM event, I calculated the local time for each user, and the average "Normalized Score" for each local time.
(The local time is the time at the timezone where you live. If you live in Japan, and the competition is at 5pm(GMT), your local time is 1am, and your score will be added to the normalized score average for 1am.)
The following graph shows the results:

Fig 2. Average Normalized Scores for each localized time
The maximum average Normal Score is at 23pm (Normalized Score 0.09), and the minimum is (surprisingly) at 10am (Normalized Score -0.11)
From between 10am to 23pm, there is no clear relationship between time and the Normalized Score, suggesting that people may perform equally well at any of these times.
At night, there is a clear decreasing trend from 3am to 8am.
It is surprising that the average Normalized Score at 1am and 2am are both positive, meaning that people are performing better at these times than usual.
Note that the standard deviation at each of these data points were around 0.9, which means that none of these data points have significant difference. Therefore, none of these trends are evidential.
Where's the best place to live?
The graph below shows the chance of an SRM event starting at a particular time.

Fig3. Ratio of SRM start times per starting time (GMT)
For each timezone, by using this frequency distribution added with the normalized score per local time (Fig.1), we can calculate the expected "Normalized Score" of a particular timezone:
for GMT time [t], let the chance of an SRM event happening at t be: p(t) (as in Fig.2)
for local time [u], let the expected normalized score of a participant competing at local time u be: s(u)
then, for a particular timezone with offset [h] from GMT,
the expected normalized score is: Σ[0<=t<24]. p(t).s(t+h)
This results are shown below (Fig4, Fig5):

Fig4. Expected Normalized Score of a timezone

Fig5. Expected Normalized Score of a timezone (as a heap map)
Interestingly, the further east you go, the better chance you have of doing well.
Note that these scores are based on the Normalized Score, which means that it is purely a representation of the effect of living at a particular timezone, when SRMs are scheduled according to the frequency distribution as in Fig.2. (and is therefore independent of other factors like education, etc)
The best places to live in are:
UTC+9 (Japan, South Korea, Indonesia)
UTC-1 (Parts of Greenland, Cape Verde)
Conclusion+Notes
I showed that there is a (non-significant) trend suggesting that competing after 2am has a negative effect on SRM performance.
However, people perform relatively well on competitions that start before 3am.
During the day, there is nothing to show that a particular time is better than another.
I also showed that the best places to live for Topcoder are East Asia, and the middle of the Atlantic, and the worst place to live is USA(!)
This is contrary to my initial presumption that the current schedule is unfavorable for East Asians (and I owe Topcoder an appology).
Some future work:
- how about other factors? weather? investment in education?
- what's the best event schedule to ensure fairness to all timezones?
他の分析エントリ
- 山手線リアルタイム混雑情報で遊んでみよう
- 140文字の「重み」を言語毎に比較してみた
- 世界で一番住みやすい場所を計算してみた
- サイゼリヤの間違い探しが難しすぎたので大人の力で解決した
- 建物のWifiをホッピングして東京から大阪まで通信できるか
- Wikipediaのデータで人生解析をしてみよう