Calculating the most liveable place in the world
Tokyo has had a run of days that are neither too cold nor too humid — really rather pleasant. A stretch like that makes you wonder whether Japan might be the most comfortable country in the world.
But where actually is the most comfortable spot on Earth? I worked it out from the numerical forecast data published by the Japan Meteorological Agency.
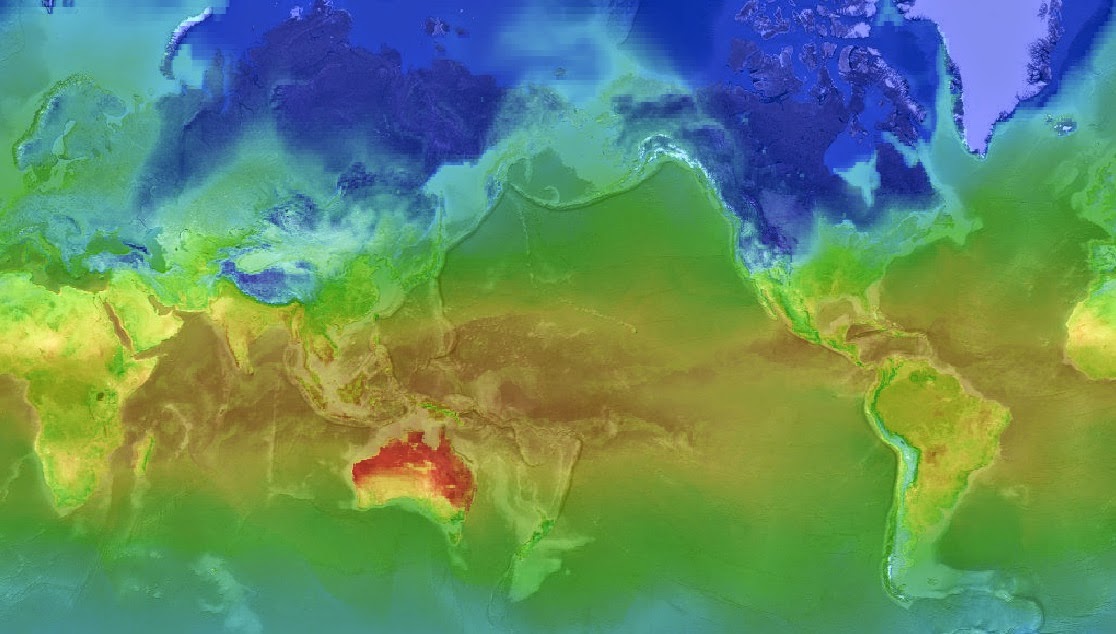
Global temperature (2013.11.30 06:00+UTC) (Background image taken from TerraMetrics for educational purposes)
Method
For source data I took the JMA's global numerical forecast model, computed every six hours. It gives temperature, humidity, wind speed, pressure and more for every half-degree cell of the planet, every six hours. (Incidentally, Synthetic Sky uses the hourly version of the same data.)
So it will tell you the temperature (above) or the humidity (below) anywhere in the world.
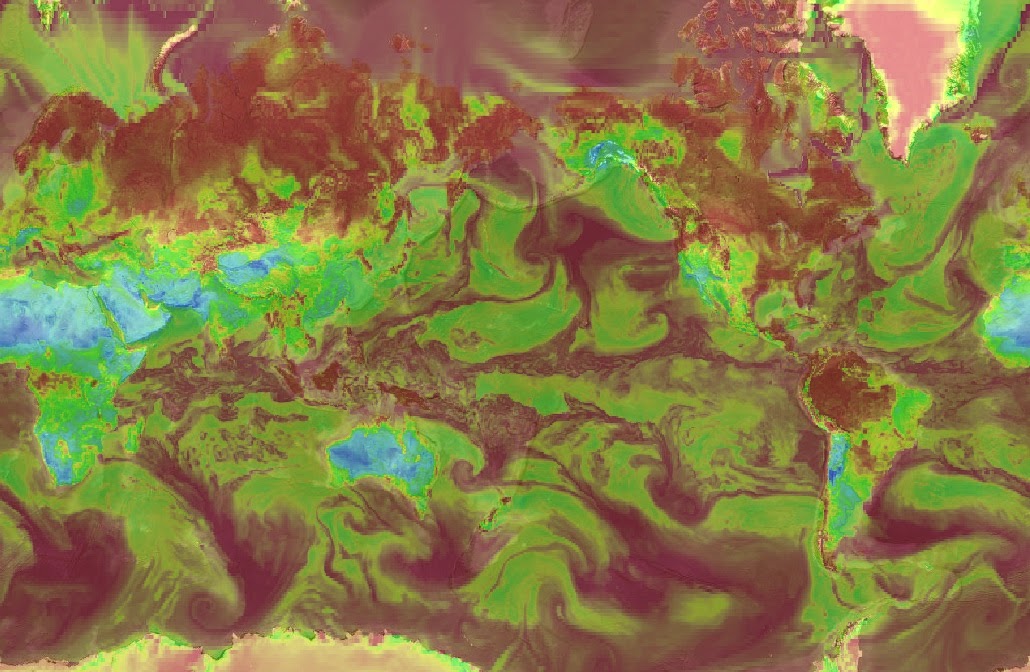
Global humidity (around 2013.11.30) (Background image taken from TerraMetrics for educational purposes)
To quantify "comfort" I used the discomfort index, which as you probably know turns temperature and humidity into a measure of discomfort. It is a little awkward to work with, though, because comfort sits around 65–70 and both directions are bad: above that is "uncomfortably hot", below it is "uncomfortably cold".
So I defined something more legible: a comfort index. It is just the discomfort index rearranged so that higher is more comfortable and lower is less:
comfort index = (where discomfort ≥ 67.5) 1-(discomfort-67.5)/(85-67.5) (where discomfort < 67.5) 1-(67.5-discomfort)/(67.5-55) (clamped into 0–1)
Why those numbers: 67.5 = the centre of the comfortable range 85 = the threshold for "unbearably hot" 55 = the threshold for "cold"
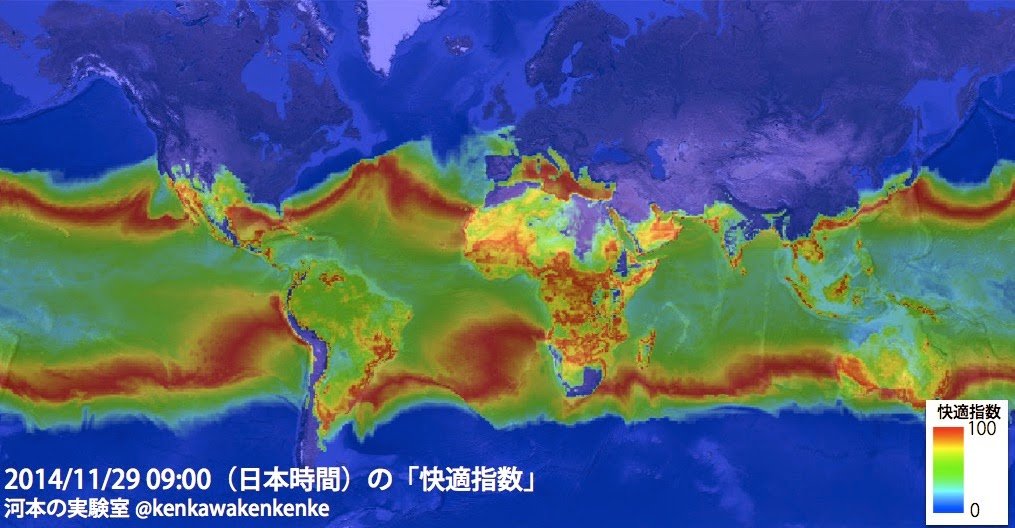
With that, every point on Earth has a "liveability". The map below is the comfort index for the day before yesterday, 29 November. Much of the northern hemisphere is blue (uncomfortable) because it is simply too cold. Around Japan the land is blue, but go out to sea and there is a spread of red (comfortable). The southern hemisphere, in spring, is comfortable across the board.
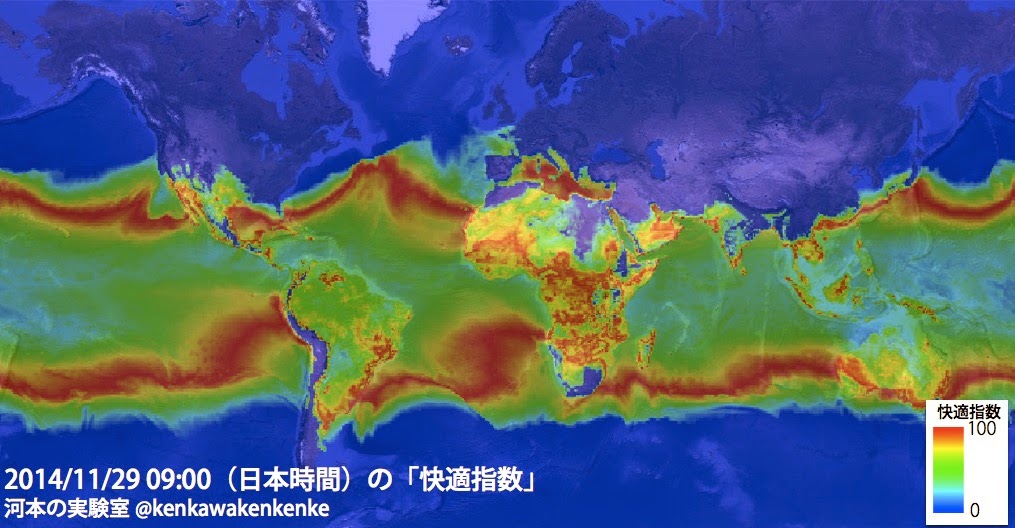
The "comfort index" across the globe (2014/11/29 09:00 JST)
I then pulled a year of this data (29 November 2013 to 29 November 2014) and computed two things:
1. Where is the average comfort index highest?
2. Where has the most "comfortable days" (discomfort index between 65 and 70) across the year?
Results
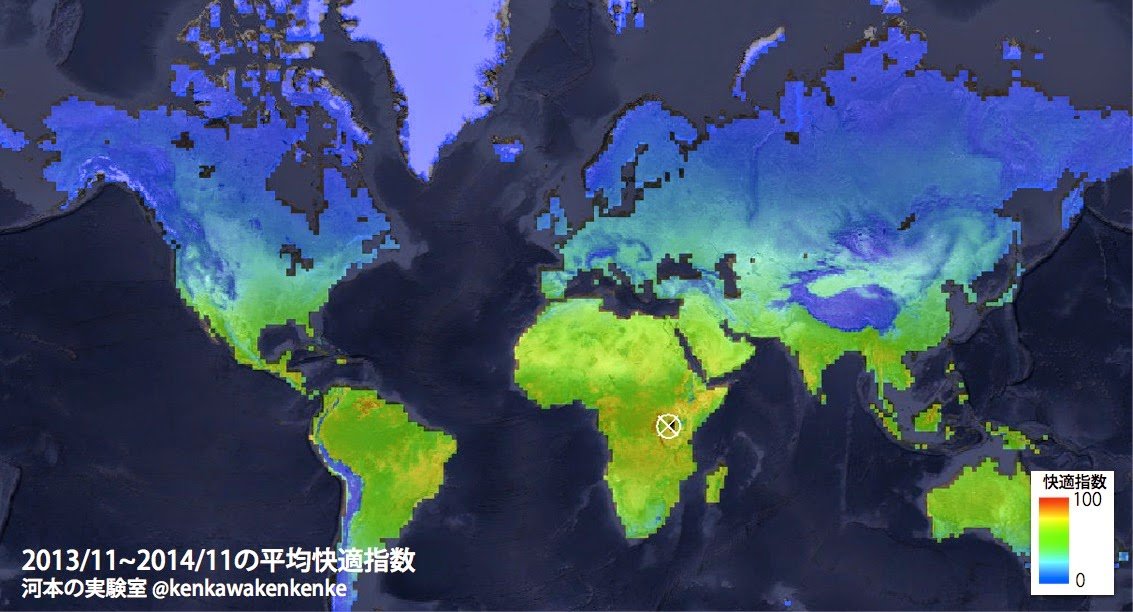
1. Where is the average comfort index highest? I simply averaged each point's six-hourly comfort index and took the maximum. Here it is:
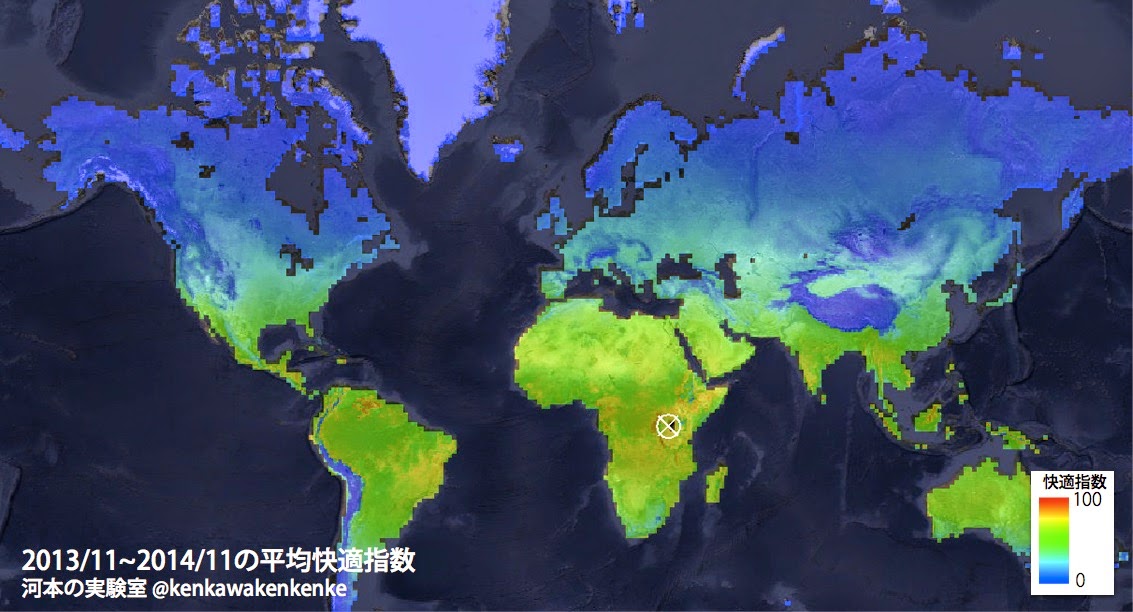
Mean comfort index, 2013/11/29–2014/11/29. The white marker is the maximum. Where on earth is that.
Wait — not Japan?
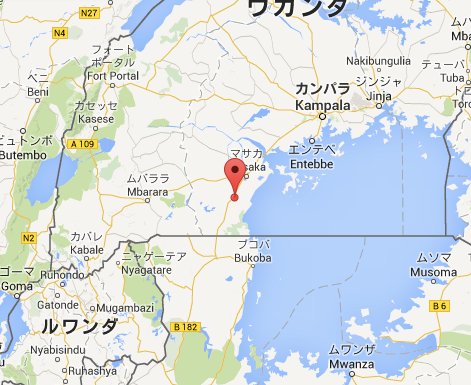
The maximum (the white marker) is in Uganda, an exceptional spot with a year-round mean comfort index of 87.4.
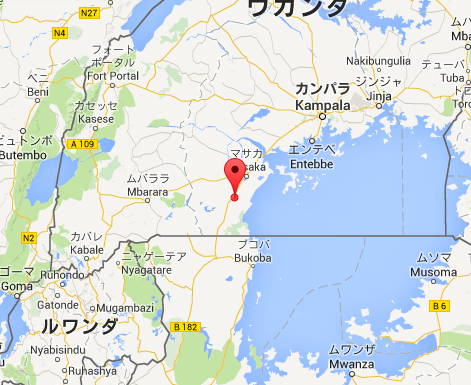
The most liveable place in the world is on the shore of Lake Victoria.
Tokyo, for comparison, averages 33.6.
The year-round traces make the gap obvious.
Tokyo's comfort index saturates in winter — too cold.
Uganda holds a high comfort level all year.
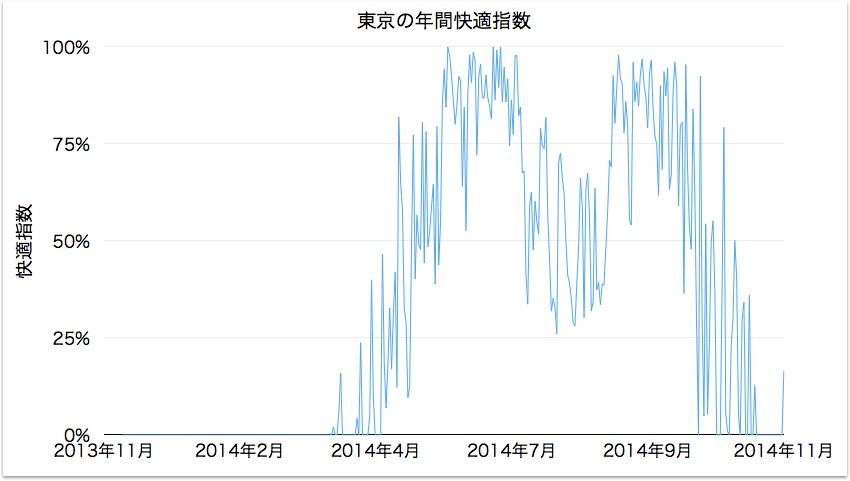
Outside spring and autumn, Tokyo's comfort index is low
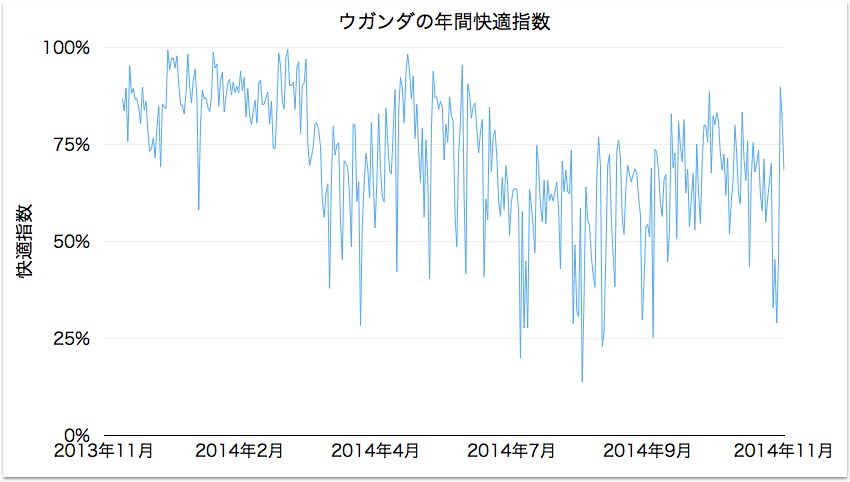
Uganda, comfortable all year round
2. Where has the most "comfortable days" (discomfort index between 65 and 70) across the year?
For each point I computed the proportion of days that were comfortable.
Here is the maximum:
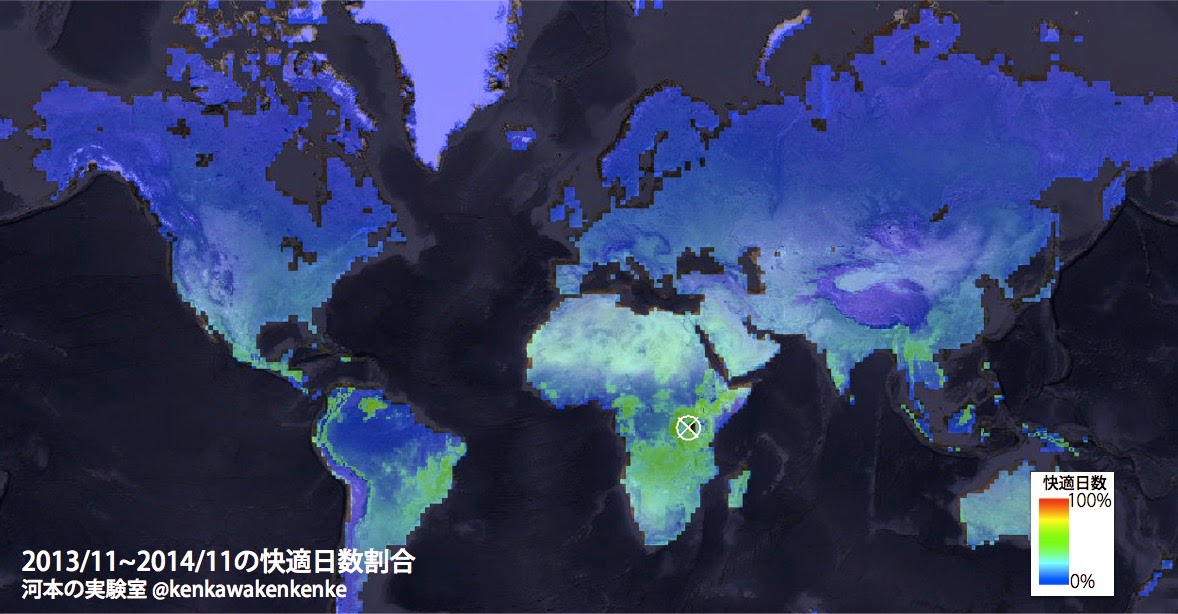
Proportion of comfortable days, 2013/11/29–2014/11/29. The white marker is the maximum. This place again.
Uganda, again.
Uganda's share of comfortable days is 77%.
Tokyo manages 14.3%, so it is not close.
The most comfortable place on Earth is, it seems, unambiguously Uganda.
A little reading tells me Uganda is known as "the Pearl of Africa" and "the green country". (source)
Thinking Japan was the most comfortable country in the world was parochial arrogance on my part. I repent.
In summary
· Retire to Uganda. My mental image of Africa was entirely baking savannah with elephants walking across it, and it is nothing of the sort. Sorry for saying "where on earth is that".
· This only considers "liveability" through a comfort index built from temperature and humidity. I would like to run it again taking in other senses of the word — the odds of being killed while walking down the street, the odds of being bitten by a pit viper, and so on.